Most Saudi fleets know what a vehicle cost to buy and roughly what they spend on fuel. Very few can tell you what a vehicle costs them per kilometre, per year, all-in — and that single number is the one that actually runs a fleet. Total cost of ownership (TCO) is the discipline of adding up every riyal a vehicle consumes across its whole working life, not just the sticker price, so you can compare vehicles honestly, spot the money pits, and know whether your fleet is getting cheaper or quietly more expensive.
This guide builds the full TCO model line by line for the Kingdom in 2026: acquisition and depreciation, fuel, maintenance and tyres, downtime, insurance, compliance and admin. Then it shows, line by line, where telematics takes cost out — because the reason to measure TCO is to reduce it. For the fuel and maintenance lines in depth, pair this with our guide to cutting fleet fuel costs and our complete fleet maintenance guide.
What is fleet total cost of ownership?
Fleet total cost of ownership is the complete lifetime cost of putting a vehicle on the road and keeping it there — from purchase to disposal — divided by the work it does. It is deliberately broader than "running costs": it captures the money you lose to depreciation and downtime, which never appear on an invoice but are often larger than the bills you do pay.
TCO is normally expressed one of two ways. Cost per kilometre (total annual cost ÷ kilometres driven) is the fairest way to compare vehicles that do different mileage. Cost per vehicle per year is easier to budget with. A good fleet tracks both, per vehicle and per class, so it can see which trucks, vans or cars are dragging the average up.
The full TCO cost stack
A complete Saudi fleet TCO model has six cost lines. Miss any of them and your number is optimistic — usually because the invisible lines (depreciation, downtime) are the ones left out.
| Cost line | What it includes | Visible on an invoice? |
|---|---|---|
| Depreciation | Loss of value from purchase to resale — often the single largest line | No — silent until you sell |
| Fuel | Diesel/petrol, driven by consumption, idling, driving style and mileage | Yes |
| Maintenance & tyres | Servicing, repairs, tyres, wear parts, workshop labour | Yes |
| Downtime | Lost revenue and cover costs while a vehicle is off the road | No — the most under-counted line |
| Insurance | Motor insurance premiums, excess, and claims history impact | Yes |
| Compliance & admin | Istimara, Fahas/MVPI, TGA fees, fines, financing interest, management time | Partly |
Acquisition and depreciation
Depreciation is the gap between what you pay for a vehicle and what you recover when you sell it, spread over the years you own it. It is usually the largest single TCO line for light vehicles and a major one for trucks, yet because it is invisible until disposal, it is routinely ignored in day-to-day cost thinking.
- Purchase and financing: the cash price plus any financing interest. In the Kingdom, VAT at 15% and delivery/registration costs belong here too.
- Resale value: what the vehicle fetches at disposal. Popular, well-maintained models with full service history and lower mileage hold value far better on the Saudi and wider Gulf used market.
- Holding period: keep a vehicle too long and maintenance and downtime rise; sell too early and you eat the steepest part of the depreciation curve. The lowest-TCO replacement point is where the rising maintenance/downtime cost crosses the falling depreciation benefit.
The practical lever here is service history and mileage — both of which a telematics and maintenance platform documents automatically. A complete, verifiable service record and honest odometer data are worth real money at resale, and they are a natural by-product of running structured fleet maintenance.
Fuel: the biggest variable line
Fuel is the largest controllable cost in most operating fleets. Saudi fuel is state-regulated and low by global standards — pump prices have sat in a modest band and are reviewed periodically rather than swinging daily — but exactly because the unit price is low, the waste inside fuel spend hides easily. The cost is not really the price per litre; it is the litres burned that did no useful work.
- Idling: in Saudi heat, engines are left running for air conditioning during every stop. Hours of daily idling burn fuel and add engine wear for zero distance covered.
- Driving style: harsh acceleration, speeding and heavy braking can lift consumption materially versus smooth driving over the same route.
- Routing and dead miles: empty running and inefficient routes pay fuel for kilometres that earn nothing.
- Fuel theft and slippage: siphoning, over-filling and fuel-card fraud quietly inflate the line — see our fuel sensor and calibration guide for how it is detected.
Every one of these is measurable and fixable with telematics, which is why fuel is usually where a TCO-reduction programme starts. The tactics are covered in detail in our 12 tactics to cut fleet fuel costs.
Maintenance, tyres and wear
Maintenance is the line fleets watch most closely because it arrives as invoices, but watching the invoices is not the same as controlling the cost. The controllable part is the split between planned and unplanned work: a scheduled service is several times cheaper than the roadside breakdown it prevents, once you count the recovery, the emergency repair and the downtime.
- Preventive servicing: service by real distance and engine hours, not a fixed calendar — a vehicle doing 4× the mileage of another needs 4× the servicing, not the same.
- Tyres: a major consumable in the Saudi climate; correct pressure and rotation extend life and cut fuel at the same time.
- Wear driven by driving style: harsh braking eats pads and tyres; the same driver data that cuts fuel cuts these parts too.
- Climate load: heat is hard on batteries, cooling systems, AC and fluids — Saudi service intervals should reflect that, not a European template.
Downtime: the most under-counted cost
Downtime is what a vehicle costs you while it is not working — and it is the line almost no fleet counts properly. A vehicle off the road still depreciates, is still insured and financed, and now earns nothing while you pay overtime, hire a replacement, or turn work away. On a productive commercial vehicle, a day of downtime can cost far more than the repair that caused it.
This is why prevention pays twice: the maintenance saving is small next to the downtime it avoids. A fleet that shifts even a portion of its failures from unplanned to planned recovers most of that cost — and the way you do it is usage-based scheduling and early fault detection, both of which need live vehicle data.
Insurance, compliance and admin
The remaining lines are smaller individually but add up, and several respond to the same data that cuts fuel and maintenance.
- Insurance: premiums track claims history and risk. Fleets that can show telematics-based driver monitoring, dash cameras and lower accident rates are better placed to negotiate, and dashcam footage speeds and strengthens claims.
- Compliance: Istimara (registration) renewal, Motor Vehicle Periodic Inspection (Fahas / MVPI), and Transport General Authority (TGA) requirements for commercial operators — each carries fees, and missing a date carries fines and off-road time.
- Fines: speeding and traffic violations are a direct cost and a signal of driving behaviour that is also inflating fuel and wear.
- Admin and management time: the hours spent chasing paperwork, reconciling fuel receipts and locating vehicles are a real cost that automation removes.
How telematics cuts each TCO line
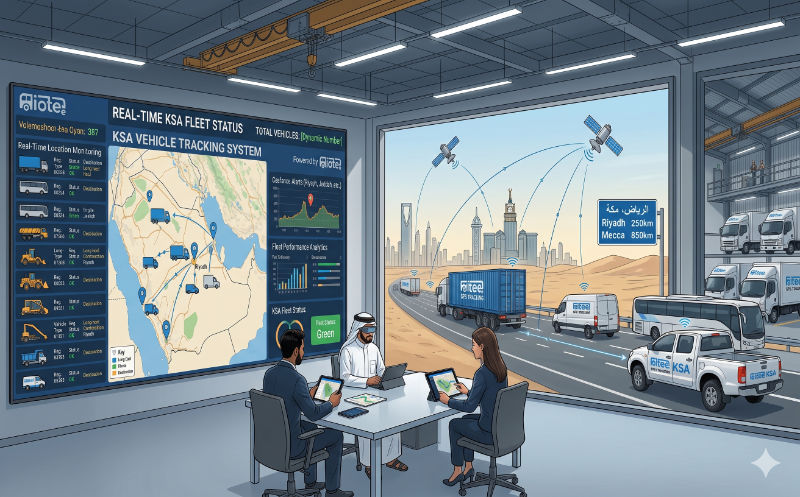
The reason TCO and telematics belong in the same conversation is that a single tracking-and-maintenance platform touches nearly every line in the model. This is the whole return-on-investment case, and it is quantified further in our GPS tracking ROI guide.
| TCO line | What telematics changes | Effect on cost |
|---|---|---|
| Fuel | Idling alerts, driver scoring, routing, fuel-theft detection | Directly lowers litres burned per useful kilometre |
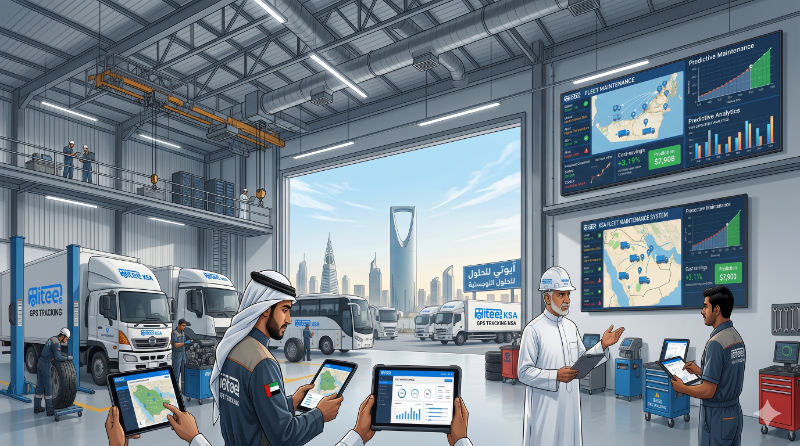
| Maintenance | Usage-based scheduling and fault-code alerts shift work from unplanned to planned | Fewer costly breakdowns and emergency repairs |
| Downtime | Early detection and scheduled service keep vehicles working | Recovers the largest hidden line in the model |
| Depreciation | Complete service history and honest mileage records | Stronger resale value at disposal |
| Insurance | Driver monitoring, dashcam evidence, lower accident rates | Better risk profile and faster claims |
| Admin | Automated location, reports and compliance reminders | Less management time per vehicle |
A worked cost-per-kilometre example
A simple model makes the idea concrete. The figures below are an illustrative structure, not a quote — plug in your own vehicles' real numbers, because the point of TCO is that it is specific to your fleet.
- Start with annual kilometres per vehicle — the denominator for everything. Pull it from the tracker, not a guess.
- Add the annual depreciation: (purchase price − expected resale) ÷ years owned.
- Add annual fuel: litres used × price per litre, straight from fuel and tracking data.
- Add annual maintenance and tyres from the workshop and service records.
- Add an estimated downtime cost: days off the road × the daily value of the vehicle working.
- Add insurance, plus compliance, fines and financing for the year.
- Sum the lines and divide by annual kilometres. That is your true cost per kilometre — now compare it across vehicles and hunt the outliers.
Run this for every vehicle and two things happen. First, a handful of outliers appear — the vehicles quietly costing double the fleet average, usually to downtime and maintenance you were not counting. Second, you get a baseline, so when you change something — cut idling, tighten servicing, replace a money pit — you can prove the TCO moved rather than hoping it did.
Common TCO mistakes Saudi fleets make
- Comparing vehicles on purchase price alone, then paying for it in fuel, downtime and poor resale for years.
- Leaving depreciation and downtime out of the model, so the number is comfortably wrong.
- Measuring cost per vehicle but never per kilometre, hiding the vehicles that do little work for high cost.
- Scheduling maintenance by calendar in a fleet where mileage varies wildly between vehicles.
- Treating telematics as a cost to cut rather than a line that pulls larger lines down.
- Never rebaselining, so nobody can prove whether last year's changes actually lowered TCO.
See your fleet's true cost per kilometre
IOTee brings GPS tracking, fuel monitoring and maintenance onto one Arabic-first platform, so every TCO line — fuel, maintenance, downtime, resale — is measured and reduced in one place. Book a free demo and we will build the picture on your own vehicles.
Request a free demo →Lowering fleet TCO across Saudi Arabia
IOTee helps fleets measure and cut total cost of ownership by combining real-time GPS tracking and fleet maintenance on one platform. Explore fleet support in Riyadh, Jeddah, Dammam, Makkah, Madinah and Khobar.